“Most startups don’t fail because they can’t build a product. Most startups fail because they can’t get traction.”
Good products don’t sell themselves. So find ways to bring your products to customers
I have been invited to be judges for many startup events. One of the most popular mistakes in the pitches I’ve seen, is that founders spend all of their time talking about how cool their ideas are. Some will talk about market opportunities, better ones will talk about product market fit on the persona level.
Only the best ones have an idea on traction channels for their products.
At today’s world, good products no longer sell themselves. You need to somehow blast through irrelevant (or sometimes relevant) noise to bring your product in front of people who need it.
Traction channels are essentially the “ways” you will use to
Get your target audience to know you exist (yes this cost quite a bit of time/money today)
Get them to consider you as one of the options (this cost even more time/money)
Convert them into your customers (this cost even more time/money than item 2)
Part 1: Divergent ideation: let’s come up with some traction channels
To start, let’s explore what are some ways we can reach our target. The following is a very rough example of the exercise. (NON-EXHAUSTIVE! Do spend time doing your homework to come up with your own list):

Let’s take a look at marketing… combining digital and traditional methods we have many ways we can reach our customers through this channel. This list is non-exhaustive!

A quick mental excercise will also give us quite a few possible routes through PR related methods. This list is non-exhaustive!
Before we dive into anything with calculations, we should spend enough time exploring possible traction channels. Don’t rule out channels at this phase; this is the step where we want to think of as many routes as possible as we want to consider most options. Keep in mind that social media marketing channels, while useful, can also be irrelevant in some cases. For example, if you need to run a one off event in a local community, sending people to hand out fliers can be a whole lot more effective than running a Facebook ad, regardless of how good you are at social media marketing.
After you have done your mental exercise on exploring traction channels, we can home into our initial sets of key traction channels. Most startups start with around 10 channels, and spend 80% of their time on top 5. Unless you have a huge team, anything more than 5 channels at the same time likely means that you are not putting enough time into any of the important ones.
Start with an educated guess (ask mentors, other ppl in the industry, etc), then iterate. Doing the next excercise will help you evaluation your traction channels.
Recommended reading: Traction: How Any Startup Can Achieve Explosive Customer Growth by Gabriel Weinberg & Justin Mares
Part 2: Convergent analysis: Traction channel analysis. This is one of the most important go-to-market (GTM) framework a startup can and should use
This table helps you list out your top channels with foundational analysis and help you achieve the following:
Identify your top performing channels (in terms of ROI, top-line contribution, and much more)
A good foundation to calculate your startup’s marketing expense, revenue streams, return on investment for your marketing initiatives, your bottleneck, etc
A very actionable analysis that tells you what you should spend time/money in. (more than half of a startup’s work is building traction/getting customers)
Startup health diagnostic
and much more
Okay let’s dive in.

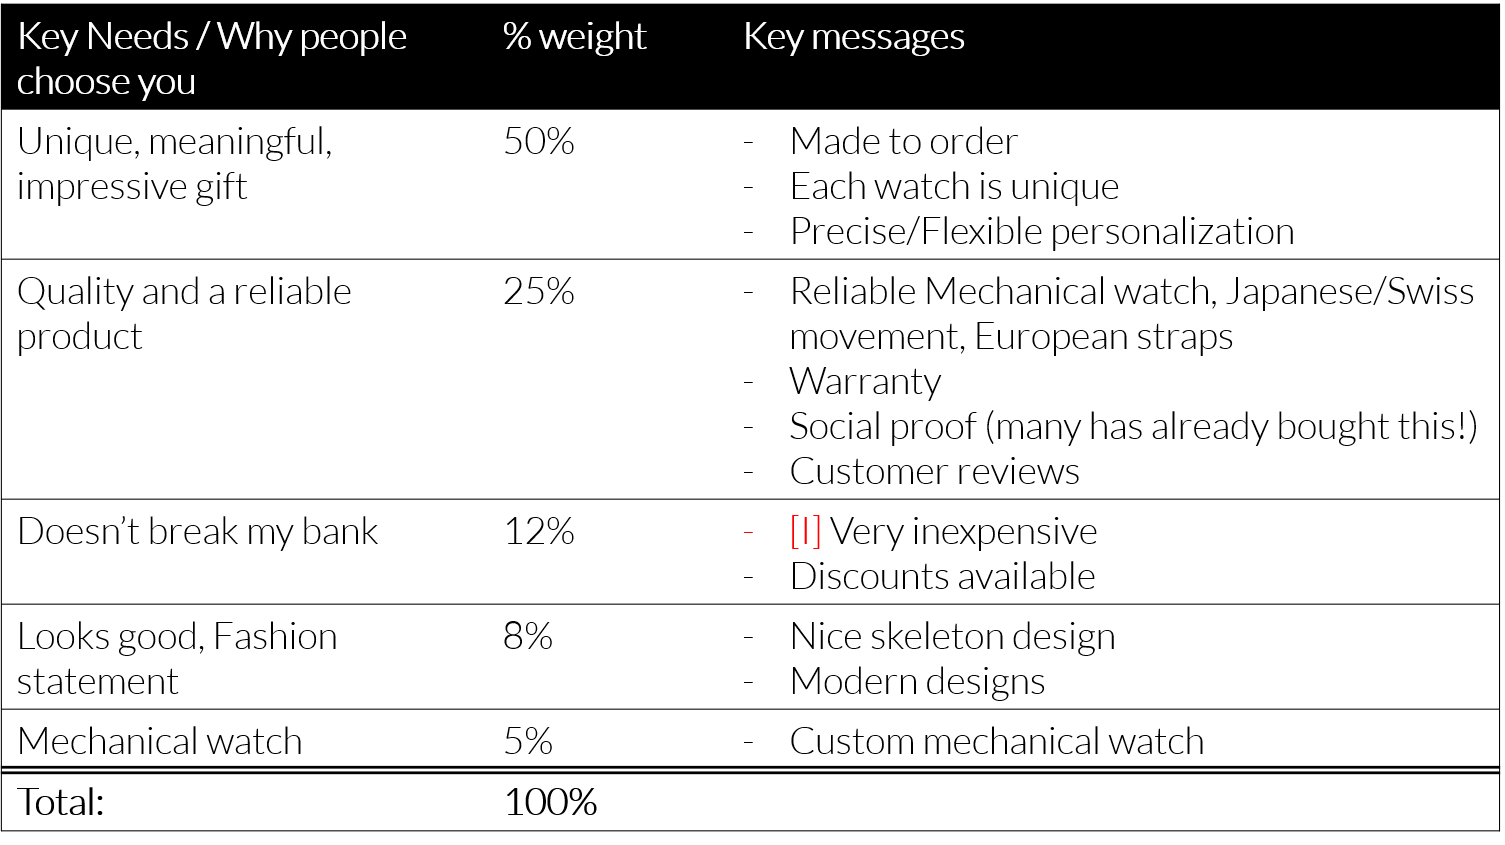
A very rough version of traction channel analysis based on very early stage EONIQ’s marketing
Column: ChanneL, description
The first column is where you enter the top traction channels that you’ve considered important for your startup. While EONIQ started as a pure online company, for demonstration purposes I also included a sales related channel into the table. You’ll notice that if you want to break things down into very fine bits, it’s possible. For example item 1: Instagram Post Ads can be broken down into IG boost posts, feed 4:5 posts, story posts, KOL sponsors and more. I’d advise against breaking down the analysis to too much fine details as that will make certain top down decisions difficult and short term fluctuations will make some rows’ calculations and analysis inconclusive at the least.
The description column basically details of the 1st column. The content should be pretty self-explanatory.
column:cac
This is one of the most important analysis any startup can do. CAC stands for Custom Acquisition Cost. Some people call this CoCA which stands for Cost of Customer Aquisition.
In a nutshell this is basically the amount of money you need to invest in any particular channel before you get 1 paying customer. In this table, you see that for Instagram Post Ads, I can get a customer after paying 30USD. In digital marketing channels these days with tracker installed this number can be automatically calculated and should be easily accessible from your ad dashboard (e.g. Facebook Ad dashboard for both Facebook and IG ads). By default these dashboard shows how much you have spent for each ad/ad sets/campaign, and they will show you how many customers you’ve gotten through the relevant ads.
Dollars spent per channel / number of customers resulted in the same channel = CAC
In our example table, channel #3, you can see the CAC is calculated to be 1000USD, as I need to pay my business developer a salary of approximately 2000USD, and he is bringing me on average 2 customers per month. 2000USD/2=1000USD per customer for this channel.
Then, shall we ignore all channels with higher CAC? Afterall the cheaper we can pay to get one customer the better that’s going to be right?
Not exactly. For two reasons, which bring us to the next two columns:
Customer Lifetime Value for each channel can be different
Each channel usually has a saturation point. i.e. you cannot put too much money into the same channel within certain specific time frame.
column:CLV
CLV stands for Customer Lifetime Value. This means how much a customer will pay you throughout the ‘customer lifespan’. To do this the very accurate way we’ll need to calculate a lot of numbers, but to make things simpler, I’ve found the following 2 methods cover most of start-up’s cases:
“1-off purchases”: If a user is buying 1 to a few products from you over a less than 1 year time frame, just make an assumption on how many baskets you’ll get, and then multiply it by the basket value. So let’s say on average someone buys 1.1 watch (I just made up this number) over the lifetime they are engaged to any certain brand, and each watch retails for 100USD. Then the CLV will be 100USD X 1.1 = 110USD. Pretty simple math. So in summary:
CLV = Basket value X Expected number of basketsSubscription (SAAS) or highly recurrent purchases (Amazon and alike): We’ll need to understand that $100 paid to us in a year’s time has a different value as $100 paid to us today. The discount has a lot to do with cost of capital (feel free to look up this term but not required) and the cost of capital has a lot to do with our operation’s risk. Skipping all the jargons and calculations, I can tell you that for high risk startups, the discount rates can range anywhere from 30%-70%. Meaning, $100 paid a year from now, is only worth as little as $30 today. “WHAT?!? 70% discount?” You may think. “I thought back interest rate is less than 10%?”. True, but that’s a bank. Considering that your startup may not exist after a year’s time, 70% discount rate for anything that happen after a year makes a lot of sense.
Now that we have established that money in the future is worth a lot less, let’s not think that some $9.99 subscription per month perpetually means infinite money. A perpetual cashflow, with discount, the NPV (Net Present Value, which is today’s value) is calculated as such:
CLV=NPV of customer’s subscription payment= (Payment within certain period)/(Discount rate over certain period)
So let’s say someone is going to pay you $9.99 per month, with a discount rate of 70% annually, the CLV is $9.99/(70%/12) = $171.36. Notice that the monthly discount rate can be obtained by dividing the yearly rate by 12.
Why is this column insightful? We our understanding that CAC is the customer acquisition cost, and that each customer is going to pay us the amount of CLV, with the CLV we basically know how much we can afford on the CAC, or how efficient we have to be with each channel. CLV gives us the unit economics. Taking watches as an example: CLV - Cost of Goods Sold - other costs - CAC leaves us with a very rough estimate of our profit. For D2C operations, with most of the retail operations online ending up with COGS at anywhere between 10-50%, I’d try to keep the CAC:CLV to around 1:3. So spending 1 dollar to get 3 dollars back (1:3 is also the ROI) is a good start.
“Okay so if I have 1:3 on my channel, does that mean I can spend as much as I want and get 3X back? I’d be rich!”
No, unfortunately. This brings us to the saturation column
column:Channel saturation
This is a surprisingly insightful column for a lot of founders. Most channels have a saturation point, meaning, above which you will invest a lot more but get a lot less in return. Above the saturation point your CAC spikes up, and your ROI goes from positive to negative.
It doesn’t take analysis to show that if you stack 2000 people handing out fliers at a road junction doesn’t help with your ROI, so I’m going to dive a bit deeper into our social media channel.
Facebook, IG, Google and the likes function very similarly in a way; they need to help businesses find the most suitable, relevant audiences for their ads. A platform with too many irrelevant ads will cause audiences to drop out. So with their algorithm they identify the most relevant viewers, and show them ads.
But as you increase your budget, you are forcing them to show the ad to more people. As a result the platforms now show your ad to semi-relevant people. Audience quality drops, the click-though-rate and interaction rate drops, then the platform concludes that your ad quality is dropping. Now that’s hurting them, so they raise your CPC (cost per click) or your CPM (Cost Per thousand (Mille) impressions). If each click/impression cost goes up, your CAC multiplies.
This column takes the most time to fill out, and is also the hardest to accurately estimate. I recommend leaving it empty, or check with your peers in similar industry to find a reasonable estimate for yourself. After you start your marketing initiatives rolling, update this column weekly.
Okay I’ve done the table. Now what?
When I’m working on EONIQ, this table takes up a good size of my mind share daily. Here’s why.
Saturation of the top 5 channels combined is basically the maximum top line I can achieve with my business.
CAC of all channels is basically my marketing expense
CLV/CAC is basically my ROI for each traction channels.
My job everyday is to lower the CAC of my main channels and to raise the CLV of my main channels
And when the top 5 channels are optimized, then I look for a new channel (company growth after optimizing on core channels)
Once you get used to thinking in this framework, you’ll be able to reverse engineer other businesses as well.